Manufacturing plants
Production lines, motors, furnaces, utilities, electrical rooms and unit-product energy.
 CHINA BENTEINDUSTRY GROUP
Industrial energy monitoring and management systems for electrical, thermal, fuel and utility balances with verified metering and actionable baselines.
PRIORITY SMART SOLUTION
Industrial energy saving, water efficiency and emissions reduction for factories, industrial parks and large buildings.
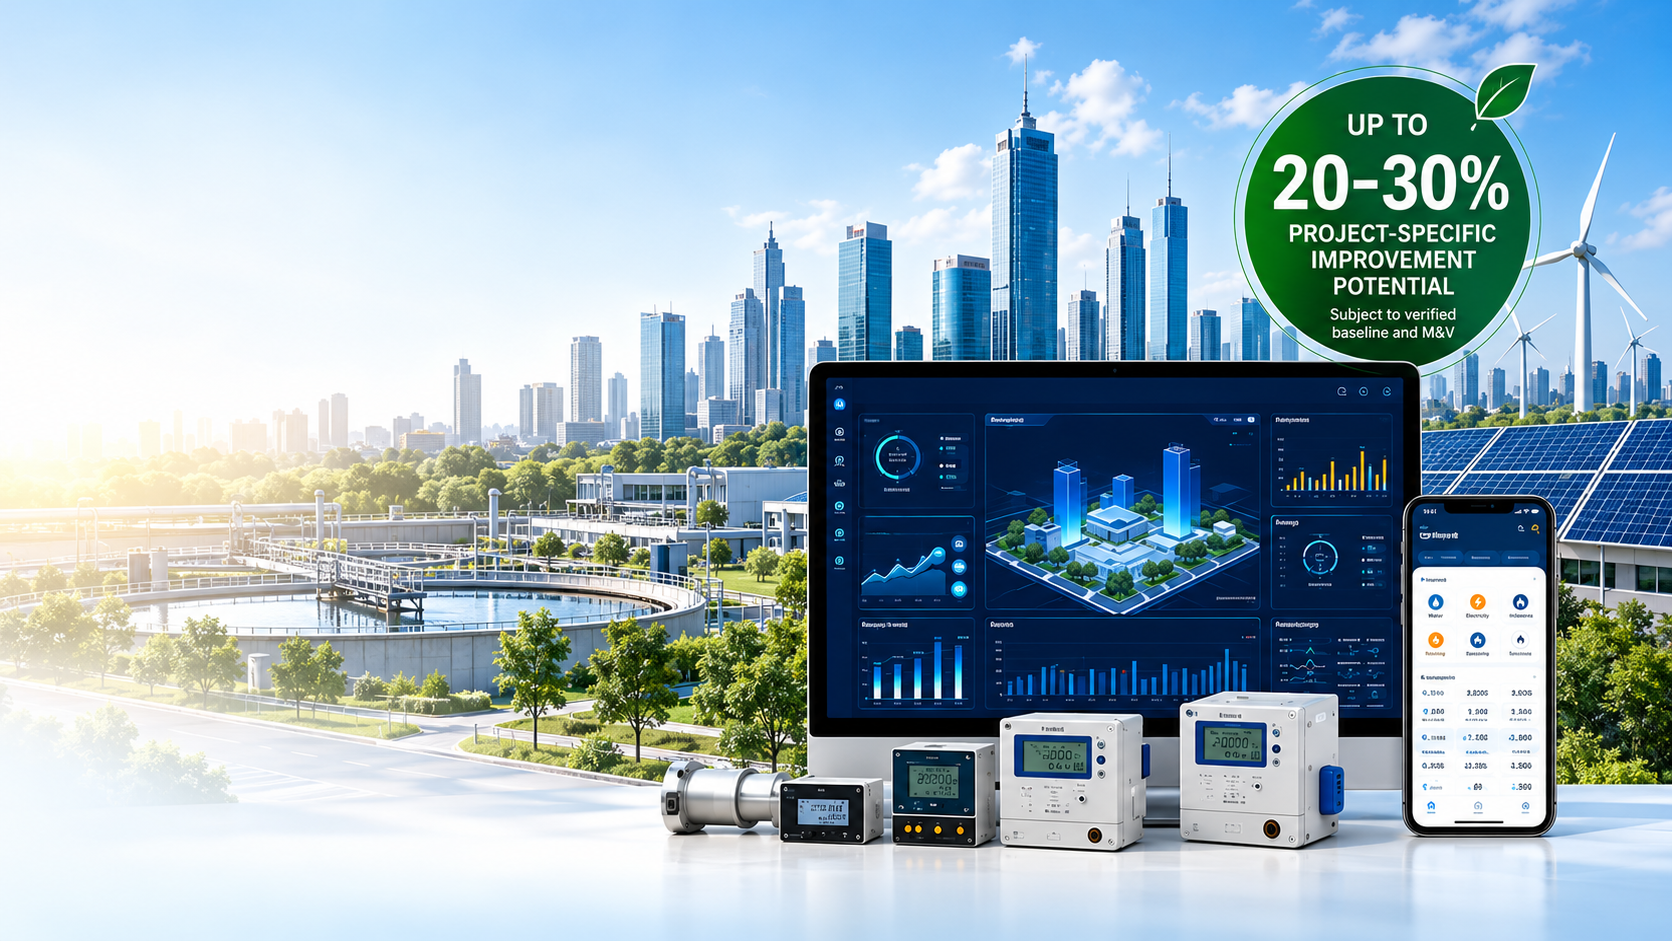
FACTORY ENERGY & WATER EFFICIENCY
This range is an engineering target for suitable projects—not a universal guarantee. The applicable target and achieved result depend on the verified baseline, operating condition, approved measures and measurement-and-verification method.
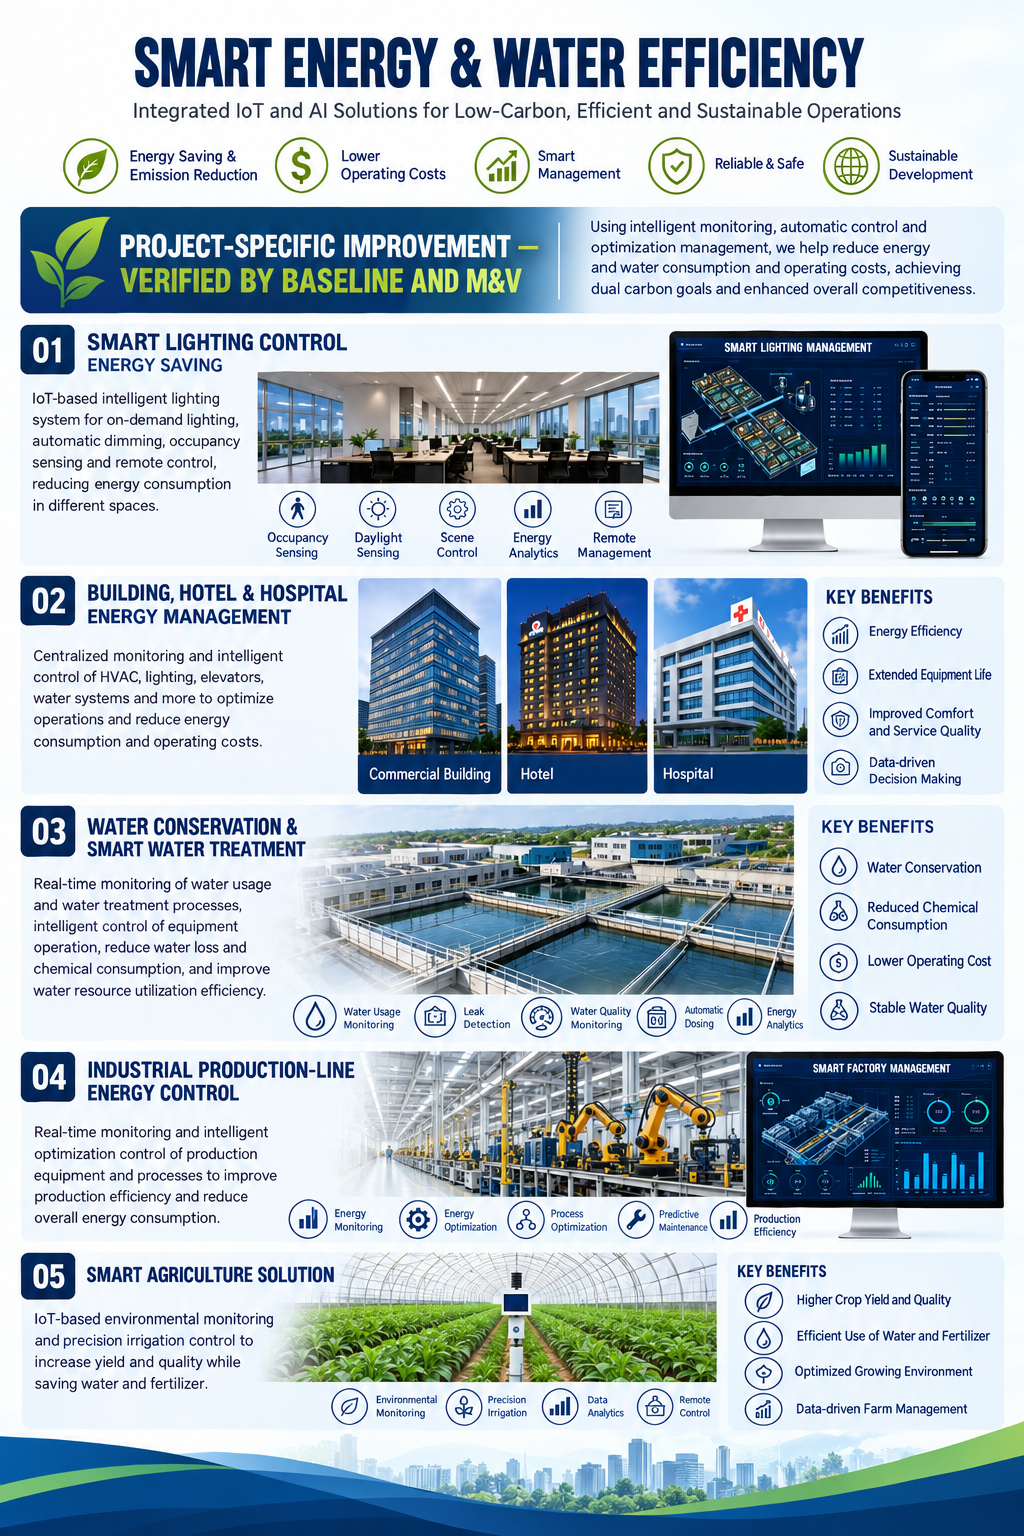
The program begins with metering and data validation, then connects electricity, water, gas, heat, cooling and compressed air to the real operating process. Improvement actions are selected only after losses, constraints and control opportunities are verified.
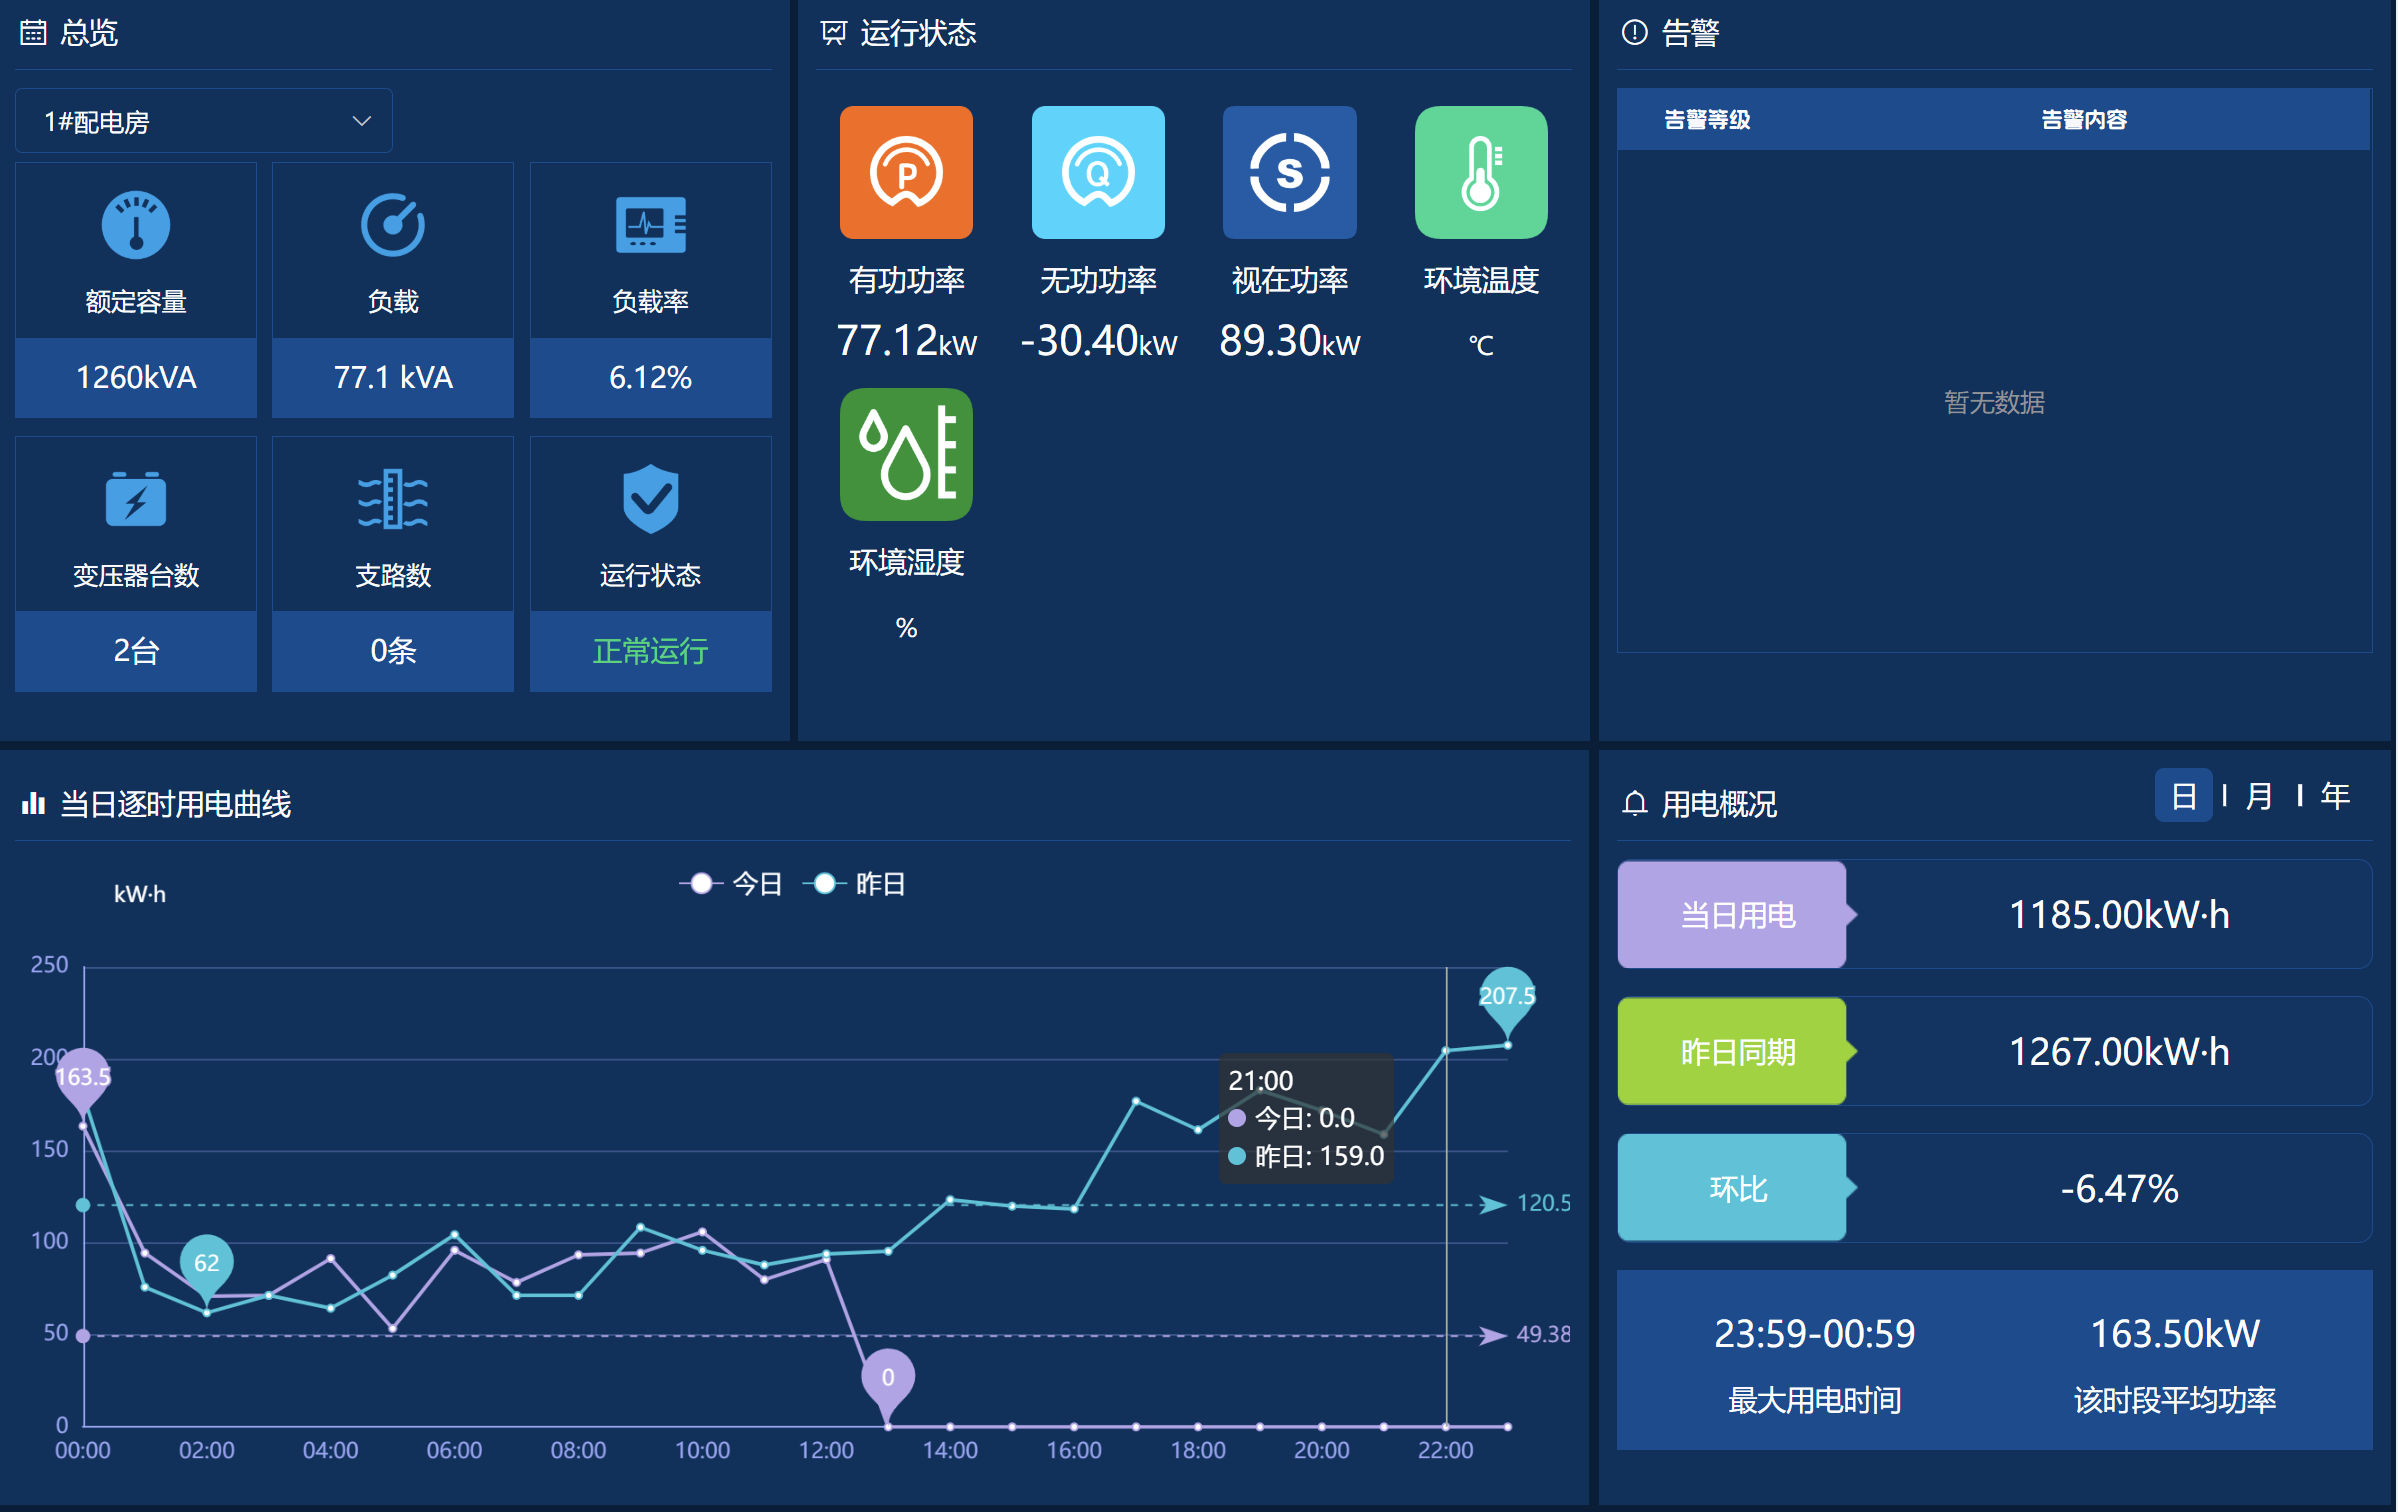
Incoming supply, transformers, distribution branches, workshops, production lines and major equipment are monitored in a consistent hierarchy. Production quantity and operating state provide the context needed to identify abnormal demand rather than simply display totals.
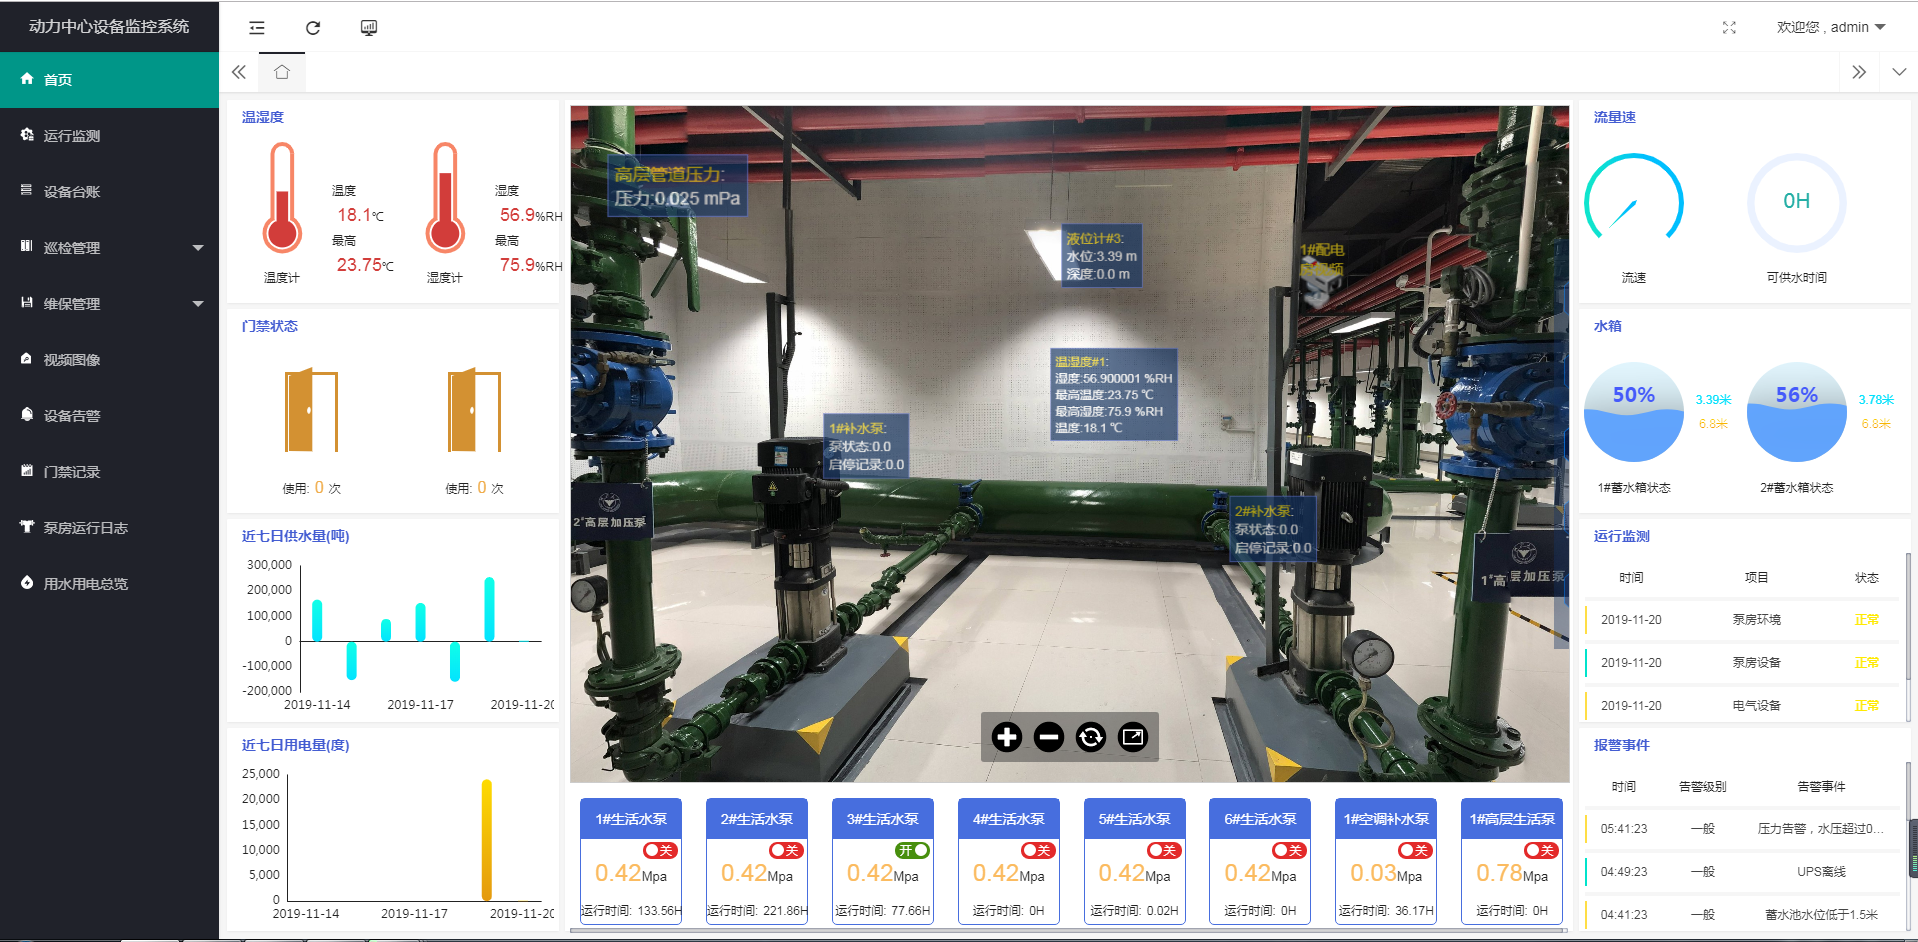
Water management covers source, storage, pressure zones, production users, treatment, reuse and discharge. The platform supports leakage analysis, quota comparison, water-quality records and remote monitoring while local safety controls remain independent.
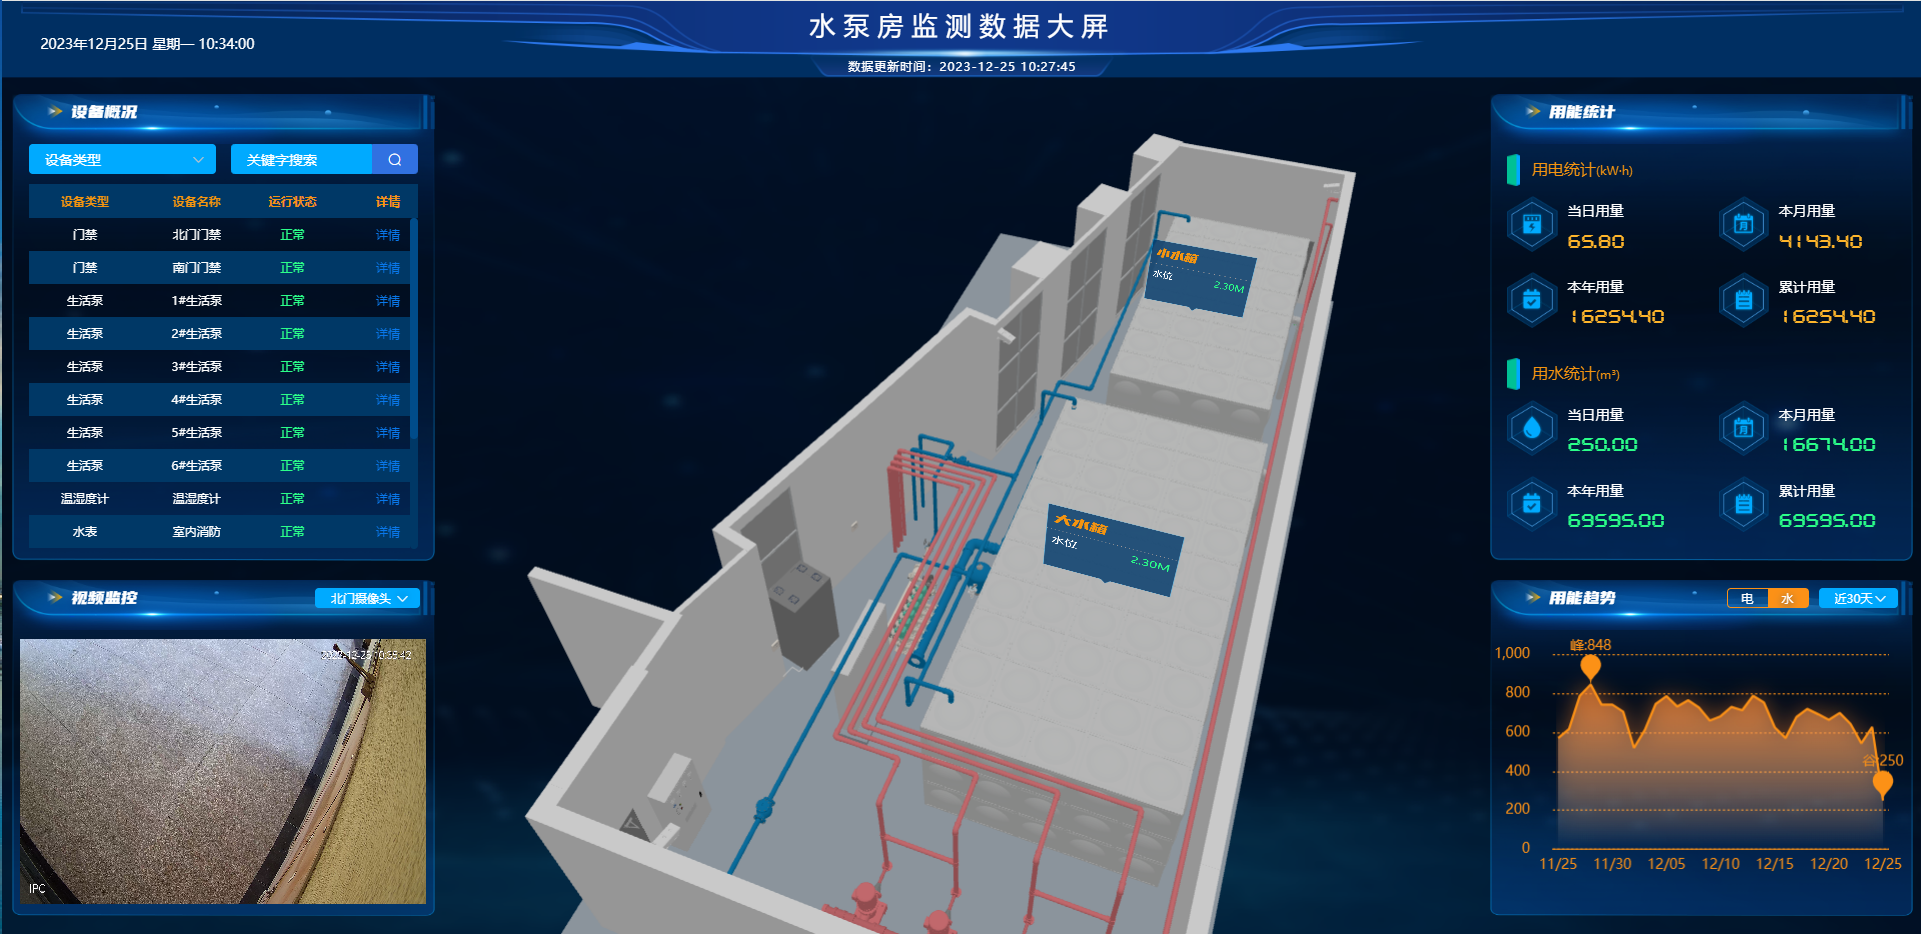
Pump-room control combines the hydraulic process with equipment condition and site safety. Operators can review pump current and voltage, valve position, pressure, flow, level and environmental alarms before taking an approved local or remote action.
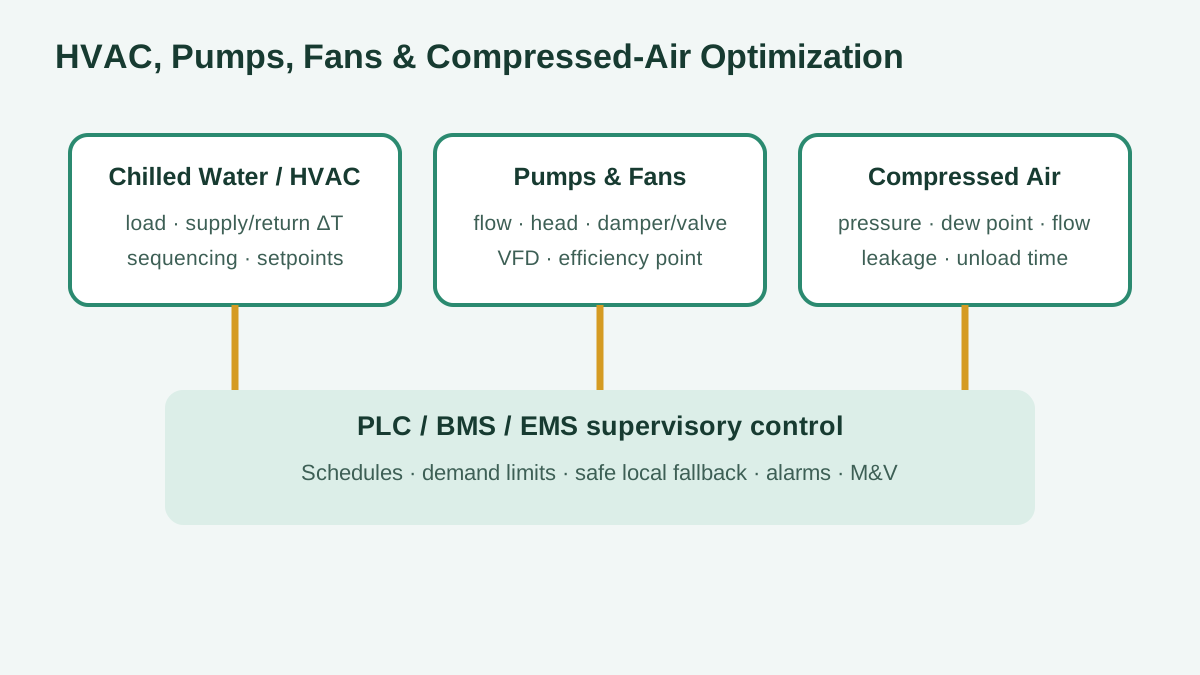
Large energy users are optimized from the actual duty: chilled-water load and temperature difference, pump and fan head, valve or damper position, compressor pressure and leakage, schedules, occupancy and production demand. Local safety and manual fallback remain intact.
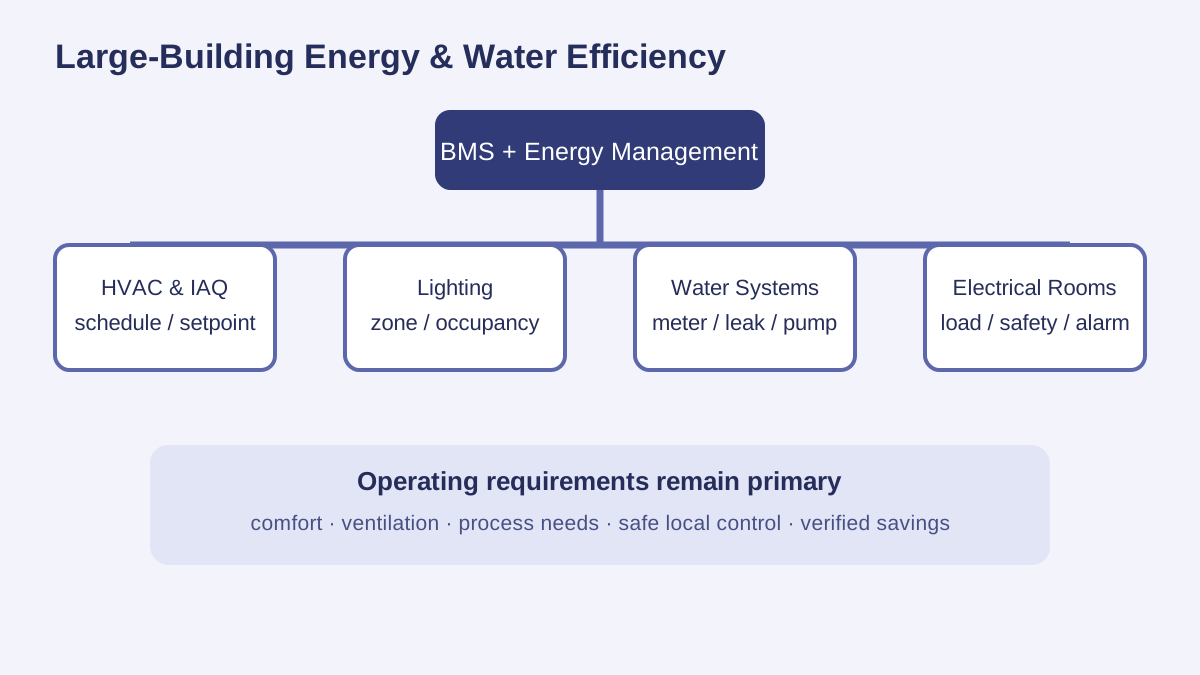
Factories, offices, warehouses, hospitals, hotels and campuses can combine occupancy and daylight sensing, scene control, dimming, HVAC schedules, zone metering and remote status. Comfort, ventilation, safety and production requirements remain the first constraint.
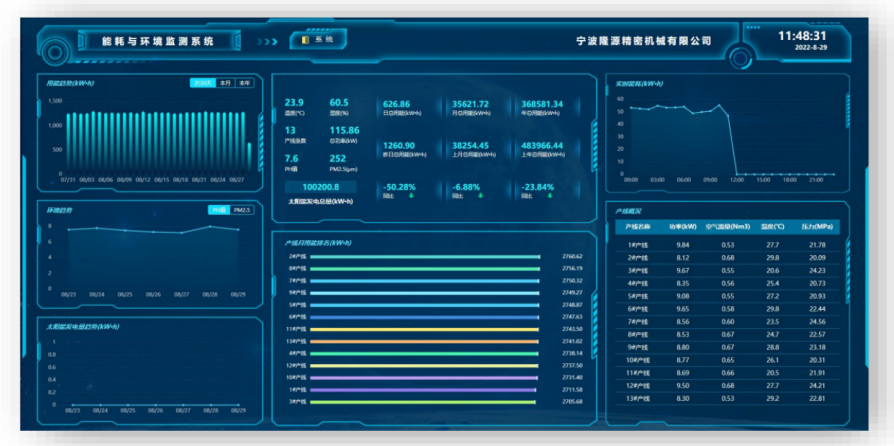
The central platform collects validated data, applies role-based permissions, records alarms and actions, and produces trend and comparison reports. Improvement is accepted only against the agreed baseline, boundary, adjustment rules and reporting period.
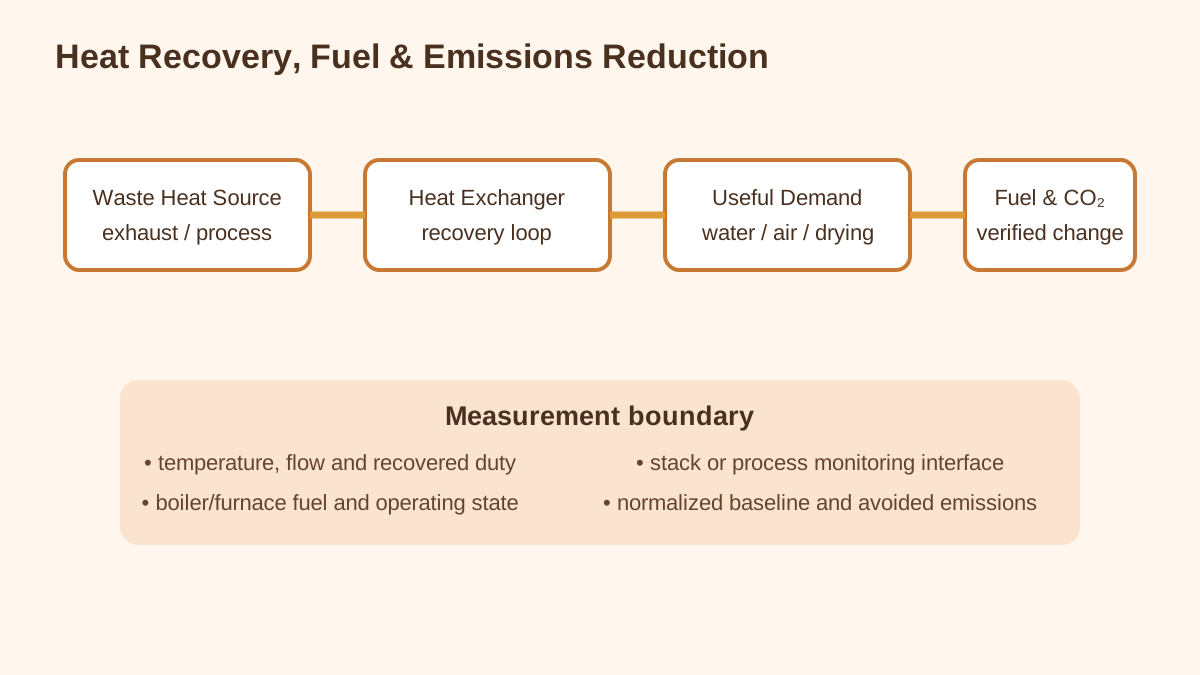
Boilers, furnaces, compressors, exhaust and hot-process streams are reviewed for heat recovery to hot water, air heating, drying, steam support or process preheating. Fuel and emissions changes are calculated only inside an agreed measurement boundary.
| Area | Required design parameters | Engineering output |
|---|---|---|
| Electricity | Load profile, peak demand, voltage, current, power factor, harmonics, operating hours and production quantity | Energy balance, abnormal-load analysis, demand and power-quality actions, motor and control opportunities |
| Water | Inlet and zone flow, pressure, level, operating schedule, process demand, reuse and discharge | Water balance, leakage and abnormal-use alarms, process-water KPI and reuse route |
| HVAC and utilities | Cooling/heating load, temperatures, flow, head, pressure, schedules, occupancy and production state | Sequencing, setpoint, VFD and utility-control strategy with safe fallback |
| Heat and emissions | Source/sink temperature, flow, fuel, stack/process data and operating coincidence | Heat-recovery duty, fuel and emissions boundary, monitoring and verification plan |
| Acceptance | Baseline period, boundary, adjustments, data quality, reporting interval and approved changes | Measured result, exceptions, normalized comparison and signed M&V report |
The same engineering framework is configured around each facility rather than copied as a generic dashboard.
Production lines, motors, furnaces, utilities, electrical rooms and unit-product energy.
Shared electricity, water, gas, steam, cooling and tenant or workshop allocation.
Refrigeration, HVAC, lighting, doors, occupancy and operating schedules.
Office buildings, hotels, hospitals and schools with HVAC, lighting and water control.
Pumps, blowers, treatment processes, chemical use, levels and water-quality interfaces.
Distributed metering, telemetry, alarms and authorized remote operating support.
They can reach up to 30% where the verified baseline, operating condition and selected measures support that potential. The project target and achieved result are confirmed through measurement and verification.
Incoming electricity and water plus major workshops, production lines, utilities and large loads are prioritized from the energy and water balance.
Verified workshop or line consumption is normalized against an agreed production quantity and operating period, with abnormal and shutdown states treated explicitly.
Yes, after checking accuracy, range, communications, timestamps, data quality, access and safe integration boundaries.
Inlet and zone balances, minimum or night flow, pressure trends, process demand and reuse/discharge records are compared to identify abnormal loss.
The survey commonly reviews motors, pumps, fans, compressors, chillers, HVAC, boilers, steam and condensate, lighting and process heat recovery.
No. Monitoring identifies and verifies opportunities; savings require approved operating changes, controls, repairs or equipment upgrades.
The parties agree the baseline, boundary, production and weather adjustments, measurement period, data-quality rules and calculation method before verification.
Share the site, process, equipment, users, data interfaces, constraints and acceptance objectives.
Request Project Evaluation →